When did prices peak?
£330,580
OCT 2024
Price history
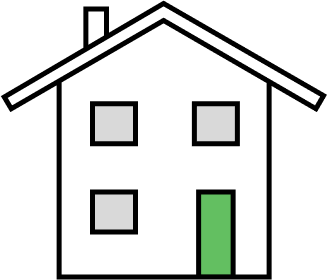
£399,507
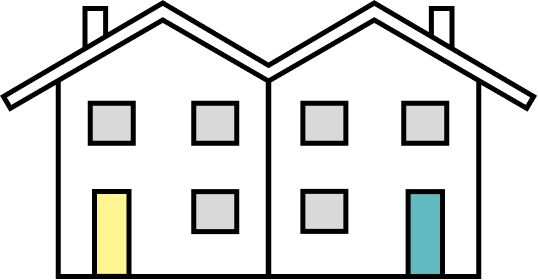
£261,526
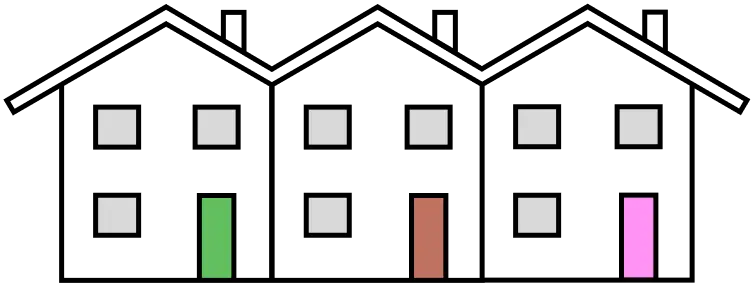
£232,240
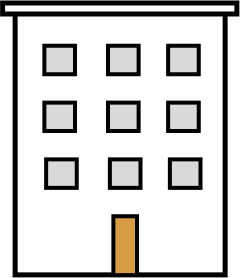
£189,846
Prices decreased by £7,317 (2.46%) over the past year
Prices increased by £78,607 (37.08%) over the past 10 years
6 key facts at a glance.
£330,580
OCT 2024
Price history872
Last 12 months · -26.0% year on year
Sales trendsDetached houses
36.5% of recent sales
Property types£200k - £300k
67.2% of sales
Price rangesHighest
Cavenham
£1,170,000
Lowest
Brandon
£235,239
2nd most expensive area of West Suffolk.
Compared with 2 areas
View West Suffolk pricesThe five highest recorded property sales in Forest Heath.
Forest Heath compared with the nearest other area in West Suffolk.
Compare Forest Heath with a different areaOpen a child area for its sold-price average. These links are the crawlable location hierarchy.
| Rank | Area | Price |
|---|---|---|
| 1 | Cavenham | £1,170,000 |
| 2 | Dalham | £753,333 |
| 3 | Higham | £636,875 |
| 4 | Moulton | £608,323 |
| 5 | Santon Downham | £577,000 |
| 6 | Herringswell | £569,625 |
| 7 | Tuddenham | £464,000 |
| 8 | Freckenham | £441,800 |
| 9 | Kentford | £412,263 |
| 10 | Worlington | £411,000 |
| 11 | Gazeley | £409,750 |
| 12 | Exning | £362,778 |
| 13 | Icklingham | £354,500 |
| 14 | Barton Mills | £351,357 |
| 15 | Lakenheath | £290,549 |
| 16 | West Row | £285,270 |
| 17 | Newmarket | £282,165 |
| 18 | Red Lodge | £276,415 |
| 19 | Beck Row, Holywell Row and Kenny Hill | £260,070 |
| 20 | Mildenhall | £252,503 |
| 21 | Eriswell | £237,590 |
| 22 | Brandon | £235,239 |
Location boundary data sourced from OpenStreetMap and price information is from HM Land Registry
Last updated at 15 September 2026 at 13:14 with the latest Land Registry data (July 2026). The Forest Heath dataset covers 2,464 postcodes.
Contains HM Land Registry data © Crown copyright and database right 2026. This data is licensed under the Open Government Licence v3.0.