When did prices peak?
£243,158
FEB 2026
Price history
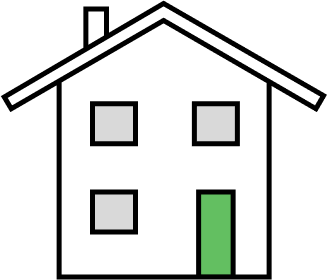
£361,672
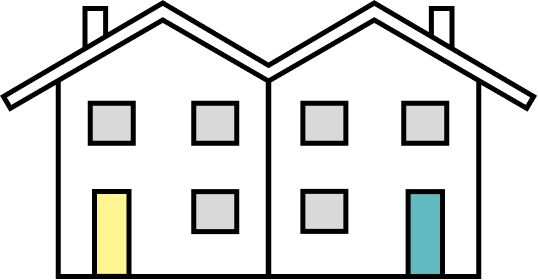
£210,167
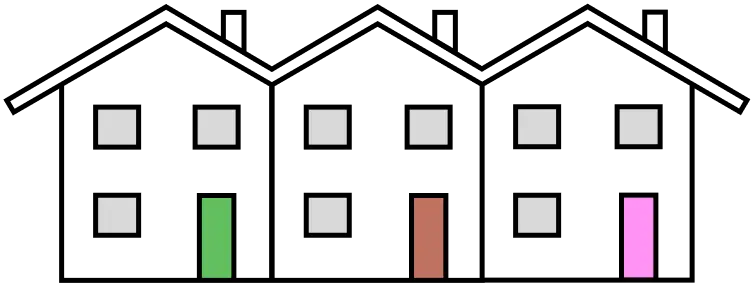
£134,721
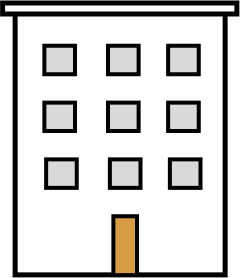
£85,586
Prices increased by £8,213 (4.14%) over the past year
Prices increased by £55,395 (36.62%) over the past 10 years
6 key facts at a glance.
£243,158
FEB 2026
Price history1,890
Last 12 months · -23.0% year on year
Sales trendsTerraced houses
34.7% of recent sales
Property types£100k - £150k
40.8% of sales
Price rangesHighest
Haighton
£697,500
Lowest
Ingol and Tanterton
£151,473
9th most expensive area of Lancashire.
Compared with 12 areas
View Lancashire pricesThe five highest recorded property sales in Preston.
Preston compared with the 6 nearest other areas in Lancashire.
Open comparison
Open comparison
Open comparison
Open comparison
Open comparison
Open comparison
Open a child area for its sold-price average. These links are the crawlable location hierarchy.
| Rank | Area | Price |
|---|---|---|
| 1 | Haighton | £697,500 |
| 2 | Goosnargh | £471,387 |
| 3 | Barton | £382,363 |
| 4 | Broughton | £360,058 |
| 5 | Grimsargh | £322,428 |
| 6 | Woodplumpton | £303,528 |
| 7 | Whittingham | £289,731 |
| 8 | Lea | £285,291 |
| 9 | Ingol and Tanterton | £151,473 |
Location boundary data sourced from OpenStreetMap and price information is from HM Land Registry
Last updated at 7 September 2026 at 00:22 with the latest Land Registry data (July 2026). The Preston dataset covers 6,043 postcodes.
Contains HM Land Registry data © Crown copyright and database right 2026. This data is licensed under the Open Government Licence v3.0.