When did prices peak?
£441,049
SEPT 2022
Price history
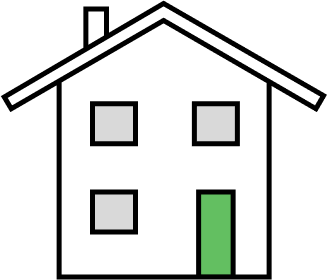
£591,025
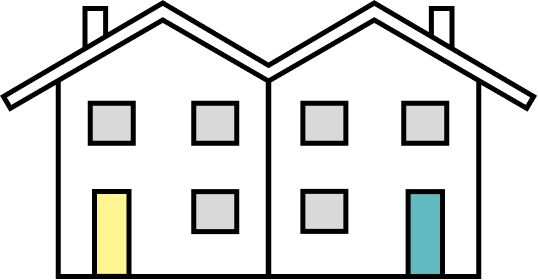
£402,332
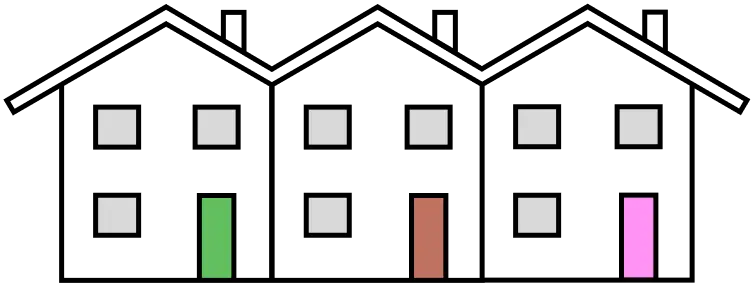
£335,479
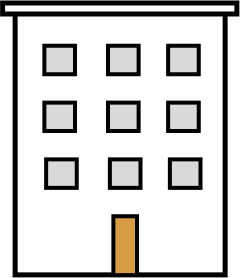
£213,272
Prices decreased by £4,890 (1.17%) over the past year
Prices increased by £104,756 (34.05%) over the past 10 years
6 key facts at a glance.
£441,049
SEPT 2022
Price history18,571
Last 12 months · -24.3% year on year
Sales trendsDetached houses
31.0% of recent sales
Property types£300k - £400k
43.1% of sales
Price rangesHighest
Ulting
£1,026,666
Lowest
Tendring
£290,907
10th most expensive area of England.
Compared with 71 areas
View England pricesThe five highest recorded property sales in Essex.
Essex compared with the 6 nearest other areas in England.
Open comparison
Open comparison
Open comparison
Open comparison
Open comparison
Open comparison
Open a child area for its sold-price average. These links are the crawlable location hierarchy.
| Rank | Area | Price |
|---|---|---|
| 1 | Ulting | £1,026,666 |
| 2 | Little Braxted | £995,000 |
| 3 | Great Braxted | £992,500 |
| 4 | Asheldham | £841,666 |
| 5 | Cold Norton | £751,695 |
| 6 | North Fambridge | £739,805 |
| 7 | Purleigh | £739,375 |
| 8 | Stow Maries | £726,166 |
| 9 | Woodham Walter | £711,222 |
| 10 | Woodham Mortimer | £682,400 |
| 11 | Wickham Bishops | £635,207 |
| 12 | Little Totham | £606,642 |
| 13 | Brentwood | £603,939 |
| 14 | Epping Forest | £593,559 |
| 15 | Great Totham | £591,329 |
| 16 | Tolleshunt Knights | £580,545 |
| 17 | Langford | £575,000 |
| 18 | Goldhanger | £552,500 |
| 19 | Uttlesford | £525,248 |
| 20 | Tolleshunt Major | £511,694 |
| 21 | Tolleshunt D'Arcy | £485,746 |
| 22 | Dengie | £475,000 |
| 23 | Hazeleigh | £471,885 |
| 24 | Heybridge Basin | £466,388 |
| 25 | Latchingdon | £452,895 |
| 26 | Mundon | £441,250 |
| 27 | Chelmsford | £439,875 |
| 28 | Mayland | £427,855 |
| 29 | Rochford | £426,544 |
| 30 | Althorne | £421,900 |
| 31 | Bradwell-on-Sea | £399,625 |
| 32 | Steeple | £399,000 |
| 33 | Tillingham | £396,078 |
| 34 | Basildon | £392,141 |
| 35 | Castle Point | £391,634 |
| 36 | Burnham-on-Crouch | £384,739 |
| 37 | St. Lawrence | £379,416 |
| 38 | Maldon | £377,942 |
| 39 | Braintree | £364,939 |
| 40 | Tollesbury | £361,021 |
| 41 | Heybridge | £351,551 |
| 42 | Southminster | £348,527 |
| 43 | Harlow | £347,666 |
| 44 | Colchester | £340,086 |
| 45 | Tendring | £290,907 |
Location boundary data sourced from OpenStreetMap and price information is from HM Land Registry
Last updated at 15 September 2026 at 02:43 with the latest Land Registry data (July 2026). The Essex dataset covers 56,414 postcodes.
Contains HM Land Registry data © Crown copyright and database right 2026. This data is licensed under the Open Government Licence v3.0.