When did prices peak?
£526,146
APR 2024
Price history
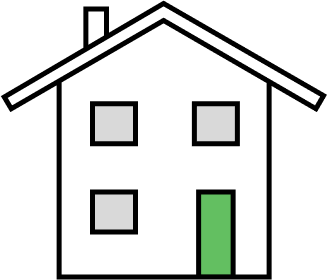
£719,767
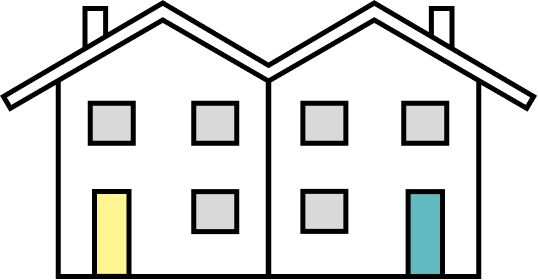
£417,430
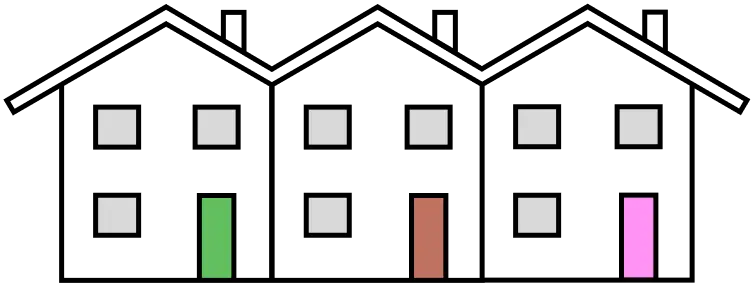
£344,037
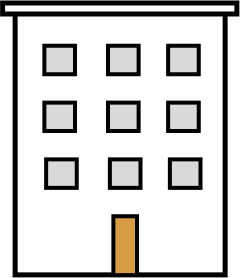
£225,564
Prices decreased by £19,696 (4.20%) over the past year
Prices increased by £76,472 (20.49%) over the past 10 years
6 key facts at a glance.
£526,146
APR 2024
Price history1,884
Last 12 months · -24.1% year on year
Sales trendsSemi-detached houses
29.9% of recent sales
Property types£300k - £400k
41.4% of sales
Price rangesHighest
West Woodhay
£9,000,000
Lowest
Hampstead Marshall
£330,000
4th most expensive area of Berkshire.
Compared with 6 areas
View Berkshire pricesThe five highest recorded property sales in West Berkshire.
West Berkshire compared with the 5 nearest other areas in Berkshire.
Open comparison
Open comparison
Open comparison
Open comparison
Open comparison
Open a child area for its sold-price average. These links are the crawlable location hierarchy.
| Rank | Area | Price |
|---|---|---|
| 1 | West Woodhay | £9,000,000 |
| 2 | Wasing | £1,750,000 |
| 3 | Combe | £1,350,000 |
| 4 | Inkpen | £1,035,000 |
| 5 | Brightwalton | £934,666 |
| 6 | Winterbourne | £925,000 |
| 7 | Chieveley | £905,694 |
| 8 | Peasemore | £897,500 |
| 9 | Bucklebury | £870,966 |
| 10 | Aldworth | £866,736 |
| 11 | Boxford | £865,500 |
| 12 | Midgham | £858,928 |
| 13 | Bradfield | £850,576 |
| 14 | Streatley | £843,166 |
| 15 | Ashampstead | £811,000 |
| 16 | Frilsham | £781,000 |
| 17 | Enborne | £776,250 |
| 18 | Leckhampstead | £755,512 |
| 19 | Tidmarsh | £743,000 |
| 20 | Farnborough | £739,262 |
| 21 | Pangbourne | £734,220 |
| 22 | Basildon | £731,478 |
| 23 | Ufton Nervet | £714,000 |
| 24 | Englefield | £695,000 |
| 25 | Beech Hill | £693,000 |
| 26 | Yattendon | £675,000 |
| 27 | Sulham | £665,000 |
| 28 | Cold Ash | £640,763 |
| 29 | Speen | £627,269 |
| 30 | Beenham | £601,384 |
| 31 | Brimpton | £576,250 |
| 32 | Wokefield | £569,500 |
| 33 | Kintbury | £552,413 |
| 34 | Welford | £524,375 |
| 35 | Chaddleworth | £524,000 |
| 36 | East Garston | £517,400 |
| 37 | Hermitage | £516,302 |
| 38 | West Ilsley | £513,750 |
| 39 | Purley on Thames | £512,979 |
| 40 | Burghfield | £509,374 |
| 41 | Stratfield Mortimer | £504,500 |
| 42 | Woolhampton | £501,250 |
| 43 | Hampstead Norreys | £501,096 |
| 44 | Compton | £500,214 |
| 45 | Great Shefford | £499,222 |
| 46 | Padworth | £494,617 |
| 47 | Shaw cum Donnington | £489,835 |
| 48 | Beedon | £488,714 |
| 49 | Fawley | £465,000 |
| 50 | Sulhamstead | £464,862 |
| 51 | Lambourn | £461,250 |
| 52 | Aldermaston | £438,166 |
| 53 | Tilehurst | £431,659 |
| 54 | Stanford Dingley | £413,333 |
| 55 | Hungerford | £385,699 |
| 56 | Greenham | £384,834 |
| 57 | Newbury | £369,617 |
| 58 | Holybrook | £368,302 |
| 59 | Thatcham | £361,982 |
| 60 | Theale | £349,514 |
| 61 | East Ilsley | £345,500 |
| 62 | Hampstead Marshall | £330,000 |
Location boundary data sourced from OpenStreetMap and price information is from HM Land Registry
Last updated at 15 September 2026 at 09:21 with the latest Land Registry data (July 2026). The West Berkshire dataset covers 10,495 postcodes.
Contains HM Land Registry data © Crown copyright and database right 2026. This data is licensed under the Open Government Licence v3.0.