
Detached
£623,420
35% above the Melbourn average
33.8% of sales

Semi-detached houses are the most common type of property sold in Melbourn, at 37.6% of sales over the past two years. Detached houses are next, at 33.8%.
Sold prices from HM Land Registry, not asking prices. How we calculate this
All house prices in MelbournHouses make up 93.6% of sales in Melbourn, and flats 6.4%. Shares cover the past two years.
| Property type | Share of sales |
|---|---|
| Semi-detached housesMost common | 37.6% |
| Detached houses | 33.8% |
| Terraced houses | 22.3% |
| Flats | 6.4% |
Average sold price by property type, and each type's share of recent sales.
£623,420
35% above the Melbourn average
33.8% of sales
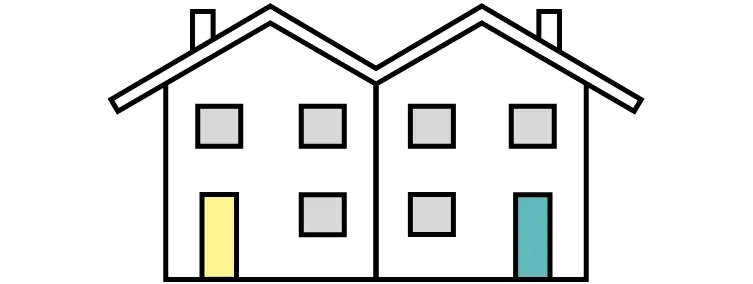
£401,930
13% below the Melbourn average
37.6% of sales
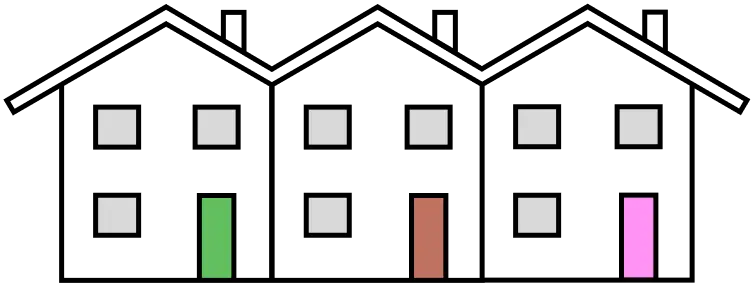
£318,700
31% below the Melbourn average
22.3% of sales

£247,625
46% below the Melbourn average
6.4% of sales
More quick answers on house prices, sales, areas and green space in Melbourn.
Price information is from HM Land Registry, location boundaries are from OpenStreetMap, and households and population are from Nomis Census 2021 postcode estimates (21 March 2021). Parks and green space are from OS Open Greenspace. Contains OS data © Crown copyright and database right 2026.
Last updated 7 October 2026 at 04:06 with the latest Land Registry data (August 2026). The Melbourn dataset covers 167 postcodes.
Contains HM Land Registry data © Crown copyright and database right 2026. This data is licensed under the Open Government Licence v3.0.