What is the average house price in Littleport?
£297,900
Average price per property type

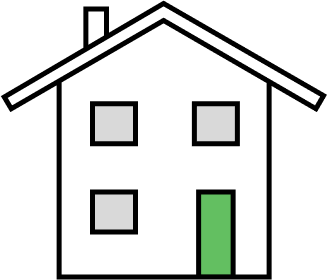
Detached
£364,933

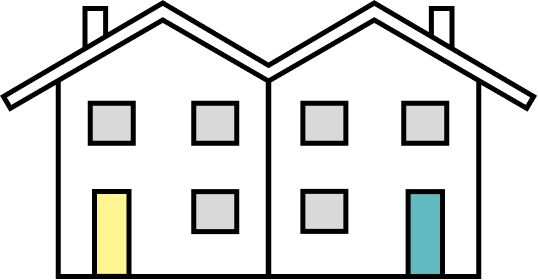
Semi-Detached
£262,036

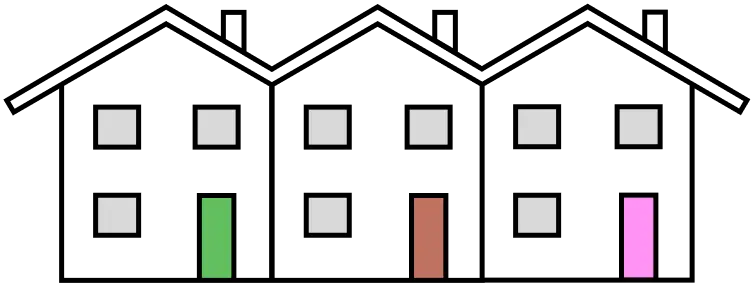
Terraced
£253,046

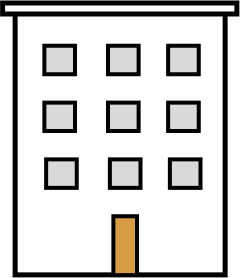
Flats
£221,666
Are prices going up or down?
Short term 📈
Prices increased by £10,444 (3.63%) over the past year
Long term 📈
Prices increased by £123,087 (70.41%) over the past 10 years
Most expensive houses in Littleport 👀
westlands wisbech road, cambridgeshire
Sold in APR 2022
£1,500,000
fieldside farm , east cambridgeshire
Sold in MAR 2024
£1,400,000
12 woodfen road, cambridgeshire
Sold in JAN 2025
£800,000
Contains HM Land Registry data © Crown copyright and database right 2021. This data is licensed under the Open Government Licence v3.0.
