When did prices peak?
£599,773
OCT 2025
Price history
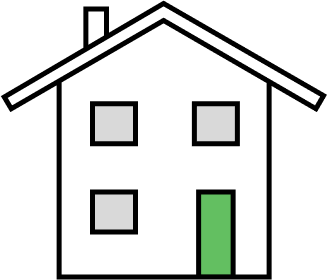
£915,153
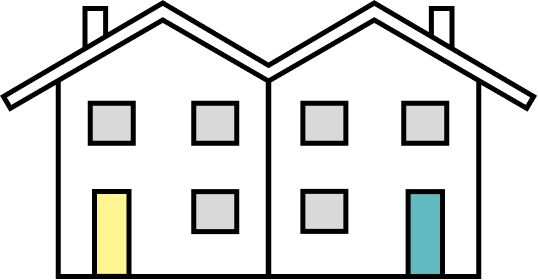
£578,893
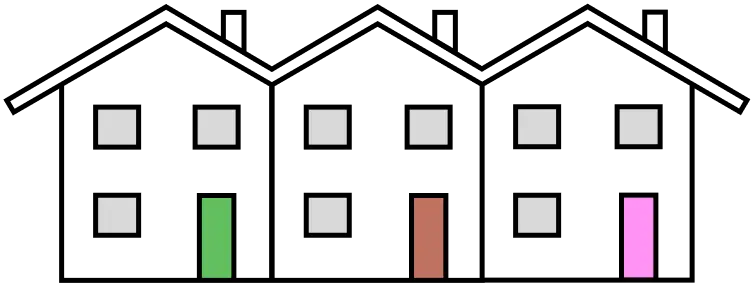
£453,063
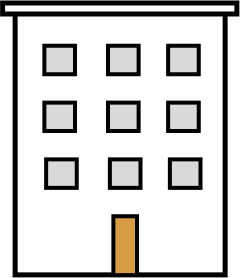
£266,926
Prices increased by £1,002 (0.19%) over the past year
Prices increased by £119,631 (28.90%) over the past 10 years
6 key facts at a glance.
£599,773
OCT 2025
Price history1,775
Last 12 months · -22.3% year on year
Sales trendsTerraced houses
35.2% of recent sales
Property types£500k - £1m
46.5% of sales
Price rangesHighest
Little Gaddesden
£2,566,250
Lowest
Nash Mills
£438,795
4th most expensive area of Hertfordshire.
Compared with 10 areas
View Hertfordshire pricesThe five highest recorded property sales in Dacorum.
Dacorum compared with the 6 nearest other areas in Hertfordshire.
Open comparison
Open comparison
Open comparison
Open comparison
Open comparison
Open comparison
Open a child area for its sold-price average. These links are the crawlable location hierarchy.
| Rank | Area | Price |
|---|---|---|
| 1 | Little Gaddesden | £2,566,250 |
| 2 | Nettleden with Potten End | £955,132 |
| 3 | Flaunden | £897,500 |
| 4 | Wigginton | £831,366 |
| 5 | Chipperfield | £817,000 |
| 6 | Berkhamsted | £802,343 |
| 7 | Tring Rural | £748,145 |
| 8 | Aldbury | £737,500 |
| 9 | Great Gaddesden | £729,285 |
| 10 | Flamstead | £712,678 |
| 11 | Kings Langley | £642,625 |
| 12 | Bovingdon | £610,789 |
| 13 | Northchurch | £609,512 |
| 14 | Tring | £541,944 |
| 15 | Markyate | £442,872 |
| 16 | Nash Mills | £438,795 |
Location boundary data sourced from OpenStreetMap and price information is from HM Land Registry
Last updated at 15 September 2026 at 09:07 with the latest Land Registry data (July 2026). The Dacorum dataset covers 6,233 postcodes.
Contains HM Land Registry data © Crown copyright and database right 2026. This data is licensed under the Open Government Licence v3.0.