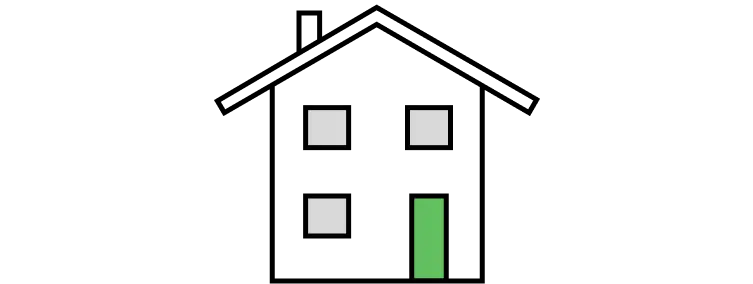
Detached
£299,333
137% above the Treorchy average
5.7% of sales

The average house price in Treorchy is £126,160, based on 93 homes sold in the 12 months to September 2026. Prices are down 10.6% (£15,004) on a year earlier.
Sold prices from HM Land Registry, not asking prices. How we calculate this
Average sold price by property type, and each type's share of recent sales.
£299,333
137% above the Treorchy average
5.7% of sales
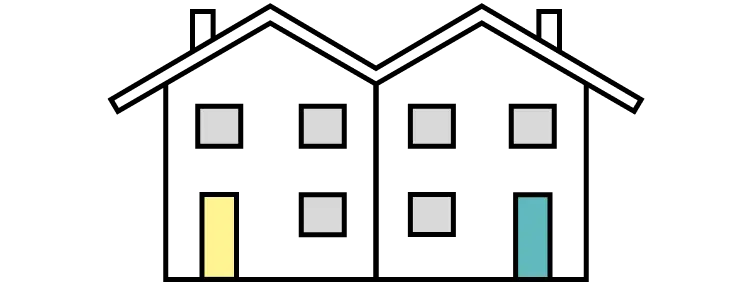
£194,500
54% above the Treorchy average
3.7% of sales
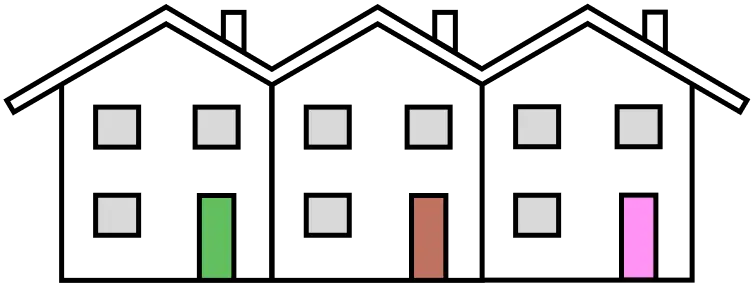
£119,722
5% below the Treorchy average
90.6% of sales
House prices in Treorchy are falling: down 10.6% (£15,004) over the past year. Over the past 10 years, prices are up 43.2% (£38,048).
−10.6%
−£15,004From £141,164 to £126,160
+43.2%
+£38,048From £88,112 to £126,160
9 key facts at a glance.
£195,833
93
Terraced houses
£100k - £150k
7,644
Population density is Very High, on a scale from Very Low to Very High.
Usual residents, including communal establishments.
3,392
Household density is Very High, on a scale from Very Low to Very High.
Occupied households, not communal establishments.
44 m² per resident
2.5% of the area · 2 public parks. Parks, playing fields, allotments and other public green space, not counting golf courses. Contains OS data © Crown copyright and database right 2026.
72 crimes per 1,000 residents
Crime rate is High, on a scale from Very Low to Very High.
Contains public sector information licensed under the Open Government Licence v3.0. Source: police.uk.
27th most expensive area of Rhondda Cynon Taf.
Compared with 39 areas
The highest recorded sale prices in Treorchy, from HM Land Registry.
#1 Most expensive sale
£530,000
Sold January 2025
View house detailsTreorchy compared with the 6 nearest other areas in Rhondda Cynon Taf.
Open comparison
Open comparison
Open comparison
Open comparison
Open comparison
Open comparison
There's a lot to think about. Whether it's a home to live in or a buy-to-let, our free checklist walks you through what to check before you make an offer.
What to check before you buyPrice information is from HM Land Registry, location boundaries are from OpenStreetMap, and households and population are from Nomis Census 2021 postcode estimates (21 March 2021). Parks and green space are from OS Open Greenspace. Contains OS data © Crown copyright and database right 2026. Crime is from police.uk street-level data. Contains public sector information licensed under the Open Government Licence v3.0. Source: police.uk.
Last updated 6 November 2026 at 00:25 with the latest Land Registry data (September 2026). The Treorchy dataset covers 243 postcodes.
Contains HM Land Registry data © Crown copyright and database right 2026. This data is licensed under the Open Government Licence v3.0.


