What is the average house price in Newport?
£247,072
Average price per property type

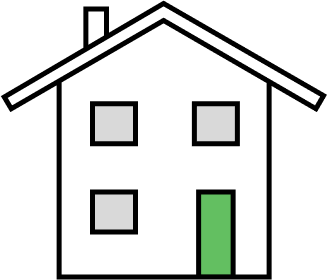
Detached
£397,582

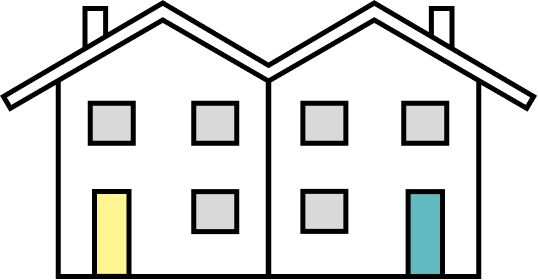
Semi-Detached
£241,050

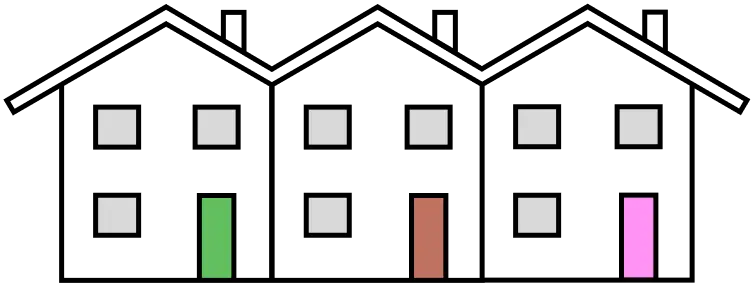
Terraced
£184,042

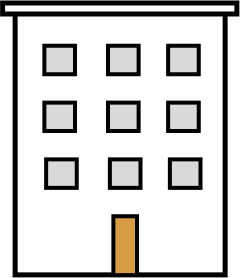
Flats
£122,506
Are prices going up or down?
Short term 📈
Prices increased by £12,648 (5.40%) over the past year
Long term 📈
Prices increased by £91,117 (58.43%) over the past 10 years
Most expensive houses in Newport 👀
dragon , newport
Sold in JUL 2014
£1,850,000
trinco house , newport
Sold in NOV 2012
£1,775,000
25 - 26 commercial street, newport
Sold in JUL 2008
£1,700,000
Areas of Newport
Areas in Newport range from £163,483 to £765,666
- The most expensive area is Michaelston-y-Vedw with an average property price of £765,666
- And the cheapest area is Victoria with an average price of £163,483
Michaelston-y-Vedw
Avg price:
£765,666
Goldcliff
Avg price:
£672,500
Redwick
Avg price:
£662,500
Llanvaches
Avg price:
£543,500
Nash
Avg price:
£496,273
Penhow
Avg price:
£445,909
Wentlooge
Avg price:
£425,833
Langstone
Avg price:
£416,561
Marshfield
Avg price:
£379,166
Graig
Avg price:
£327,820
Allt-Yr-Yn
Avg price:
£321,240
Llanwern
Avg price:
£318,781
Rogerstone
Avg price:
£317,649
Caerleon
Avg price:
£307,418
Malpas
Avg price:
£234,549
Tredegar Park
Avg price:
£230,524
Coedkernew
Avg price:
£225,050
Alway
Avg price:
£222,877
Beechwood
Avg price:
£220,505
Gaer
Avg price:
£206,132
Ringland
Avg price:
£204,693
Stow Hill
Avg price:
£199,791
Bishton
Avg price:
£195,750
St. Julians
Avg price:
£194,980
Pillgwenlly
Avg price:
£184,693
Liswerry
Avg price:
£177,943
Bettws
Avg price:
£173,285
Shaftesbury
Avg price:
£168,008
Victoria
Avg price:
£163,483
Contains HM Land Registry data © Crown copyright and database right 2021. This data is licensed under the Open Government Licence v3.0.
