What is the average house price in Newport?
£248,204
Average price per property type

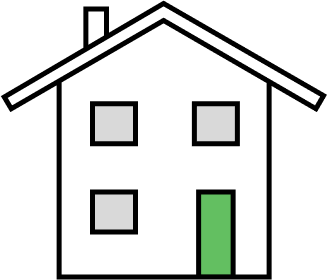
Detached
£397,047

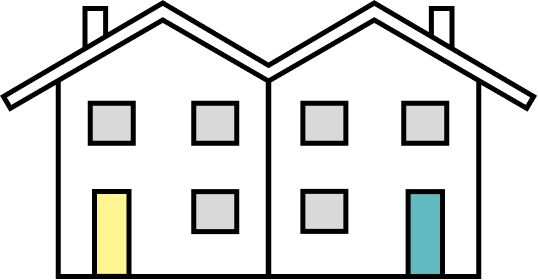
Semi-Detached
£245,366

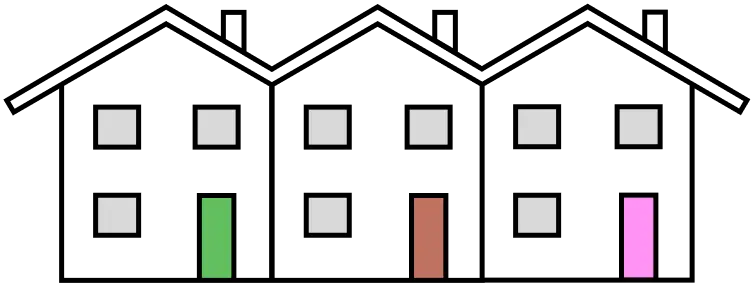
Terraced
£183,114

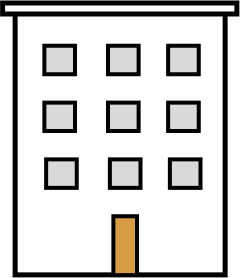
Flats
£123,236
Are prices going up or down?
Short term 📈
Prices increased by £13,247 (5.64%) over the past year
Long term 📈
Prices increased by £89,573 (56.47%) over the past 10 years
Most expensive houses in Newport 👀
dragon , newport
Sold in JUL 2014
£1,850,000
trinco house , newport
Sold in NOV 2012
£1,775,000
25 - 26 commercial street, newport
Sold in JUL 2008
£1,700,000
What is the most expensive (and cheapest) area of Newport?
Areas in Newport range from £166,769 to £765,666. The most expensive area is Michaelston-y-Vedw with an average property price of £765,666. The cheapest area is Bettws with an average of £166,769
The full list of areas is below. Click on any of them to go deeper into that area.
| Rank | Area | Price |
|---|---|---|
| 1 | Michaelston-y-Vedw | £765,666 |
| 2 | Goldcliff | £672,500 |
| 3 | Redwick | £662,500 |
| 4 | Llanvaches | £543,500 |
| 5 | Nash | £496,273 |
| 6 | Penhow | £464,150 |
| 7 | Langstone | £416,568 |
| 8 | Wentlooge | £399,375 |
| 9 | Marshfield | £383,257 |
| 10 | Allt-Yr-Yn | £331,707 |
| 11 | Graig | £330,018 |
| 12 | Llanwern | £318,420 |
| 13 | Caerleon | £316,539 |
| 14 | Rogerstone | £314,163 |
| 15 | Malpas | £241,618 |
| 16 | Tredegar Park | £233,848 |
| 17 | Coedkernew | £232,761 |
| 18 | Beechwood | £229,389 |
| 19 | Alway | £221,585 |
| 20 | Ringland | £207,077 |
| 21 | Gaer | £205,166 |
| 22 | St. Julians | £201,162 |
| 23 | Bishton | £197,869 |
| 24 | Stow Hill | £193,120 |
| 25 | Pillgwenlly | £190,053 |
| 26 | Liswerry | £180,343 |
| 27 | Shaftesbury | £169,627 |
| 28 | Victoria | £168,306 |
| 29 | Bettws | £166,769 |
Contains HM Land Registry data © Crown copyright and database right 2021. This data is licensed under the Open Government Licence v3.0.
