When did prices peak?
£245,959
NOV 2025
Price history
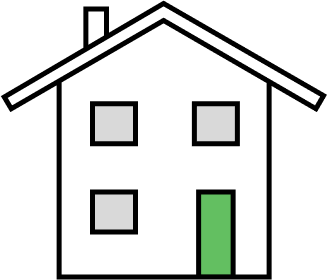
£305,289
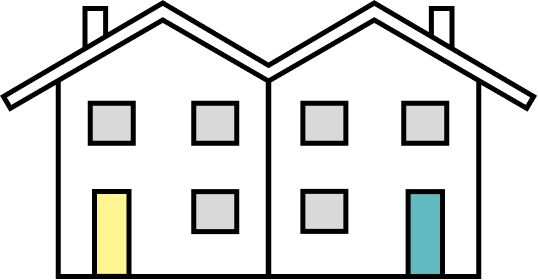
£168,604
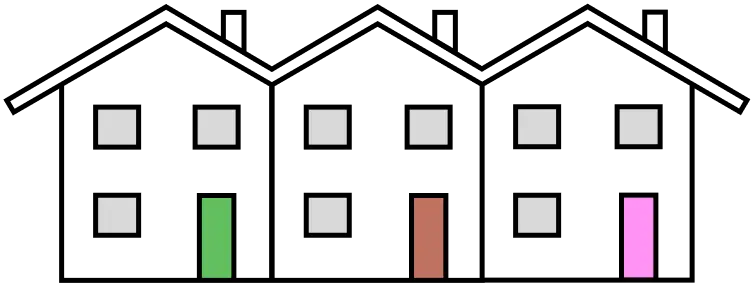
£148,536
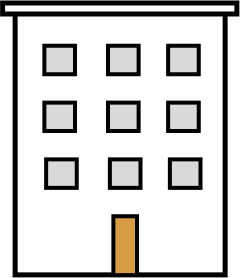
£102,416
Prices increased by £7,080 (3.56%) over the past year
Prices increased by £72,228 (54.10%) over the past 10 years
5 key facts at a glance.
£245,959
NOV 2025
Price history319
Last 12 months · -33.1% year on year
Sales trendsSemi-detached houses
41.5% of recent sales
Property types£150k - £200k
47.5% of sales
Price ranges1st most expensive area of .
Compared with 2 areas
View pricesThe five highest recorded property sales in Kirkby-in-Ashfield.
Location boundary data sourced from OpenStreetMap and price information is from HM Land Registry
Last updated at 21 May 2026 at 00:44 with the latest Land Registry data (March 2026). The Kirkby-in-Ashfield dataset covers 763 postcodes.