What is the average house price in St Stephen?
£614,867
Average price per property type

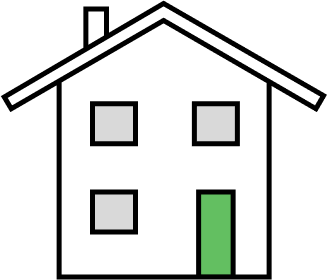
Detached
£741,232

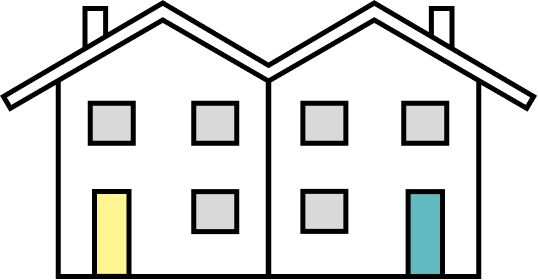
Semi-Detached
£648,594

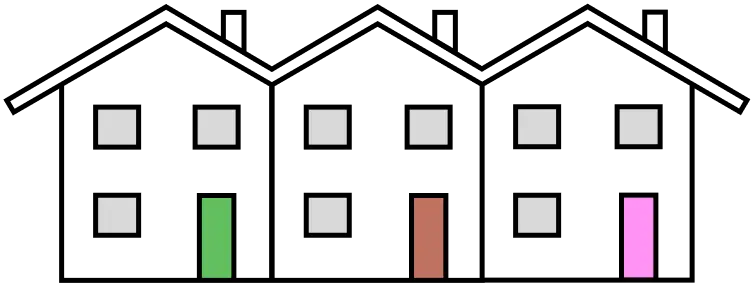
Terraced
£450,467

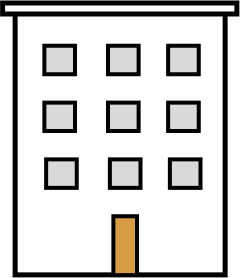
Flats
£299,623
Are prices going up or down?
Short term 📉
Prices decreased by £-2,581 (-0.42%) over the past year
Long term 📈
Prices increased by £181,764 (41.97%) over the past 10 years
Most expensive houses in St Stephen 👀
unit 6 curo park, hertfordshire
Sold in AUG 2023
£3,180,000
riverside stables drop lane, hertfordshire
Sold in FEB 2023
£2,400,000
burston manor north orbital road, hertfordshire
Sold in JUL 2022
£2,100,000
Contains HM Land Registry data © Crown copyright and database right 2021. This data is licensed under the Open Government Licence v3.0.
