What is the average house price in Ynys Môn / Isle of Anglesey?
£249,290
Average price per property type

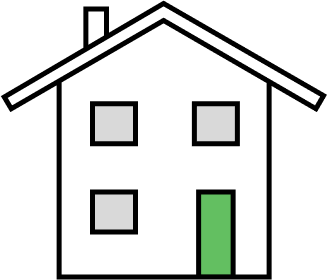
Detached
£342,364

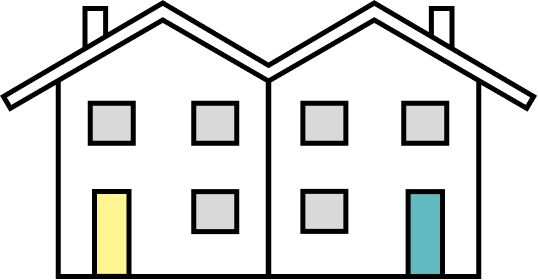
Semi-Detached
£210,237

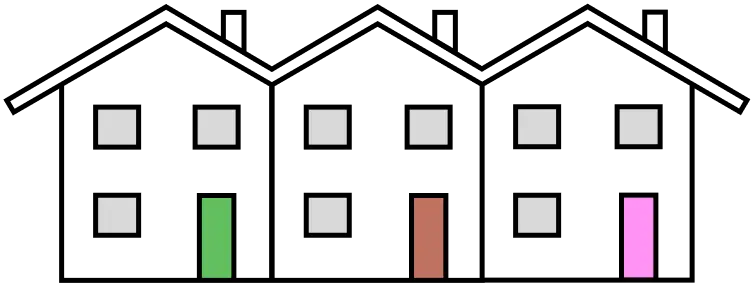
Terraced
£156,898

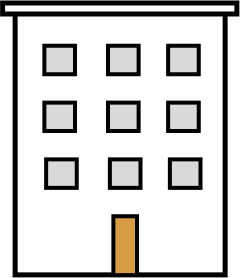
Flats
£202,616
Are prices going up or down?
Short term 📉
Prices decreased by £-13,277 (-5.06%) over the past year
Long term 📈
Prices increased by £81,746 (48.79%) over the past 10 years
Most expensive houses in Ynys Môn / Isle of Anglesey 👀
craig allan , isle of anglesey
Sold in JUN 2023
£2,850,000
ger y dwr , isle of anglesey
Sold in AUG 2019
£2,850,000
tanygraig , isle of anglesey
Sold in OCT 2023
£2,450,000
What is the most expensive (and cheapest) area of Ynys Môn / Isle of Anglesey?
Areas in Ynys Môn / Isle of Anglesey range from £159,202 to £521,576. The most expensive area is Llanfaelog with an average property price of £521,576. The cheapest area is Llannerch-y-Medd with an average of £159,202
The full list of areas is below. Click on any of them to go deeper into that area.
| Rank | Area | Price |
|---|---|---|
| 1 | Llanfaelog | £521,576 |
| 2 | Llanddona | £462,300 |
| 3 | Trearddur | £446,727 |
| 4 | Llaneugrad | £414,000 |
| 5 | Cylch-y-Garn | £380,750 |
| 6 | Llanddyfnan | £361,285 |
| 7 | Beaumaris | £342,651 |
| 8 | Llanddaniel Fab | £322,327 |
| 9 | Rhoscolyn | £318,571 |
| 10 | Llanfair-Mathafarn-Eithaf | £315,955 |
| 11 | Cwm Cadnant | £315,062 |
| 12 | Moelfre | £310,636 |
| 13 | Llaneilian | £295,200 |
| 14 | Valley | £284,973 |
| 15 | Llangristiolus | £264,000 |
| 16 | Penmynydd | £262,500 |
| 17 | Llangoed | £259,937 |
| 18 | Menai Bridge | £259,638 |
| 19 | Trewalchmai | £256,500 |
| 20 | Rhosybol | £251,937 |
| 21 | Llanfaethlu | £248,083 |
| 22 | Tref Alaw | £245,500 |
| 23 | Bodorgan | £242,900 |
| 24 | Bodffordd | £238,000 |
| 25 | Aberffraw | £236,666 |
| 26 | Llanbadrig | £232,052 |
| 27 | Llanfachraeth | £230,900 |
| 28 | Llanfair Pwllgwyngyll | £229,738 |
| 29 | Pentraeth | £228,666 |
| 30 | Rhosyr | £221,016 |
| 31 | Mechell | £214,990 |
| 32 | Llangefni | £212,327 |
| 33 | Bryngwran | £210,500 |
| 34 | Bodedern | £205,571 |
| 35 | Llanfihangel Ysgeifiog | £200,689 |
| 36 | Llanidan | £198,500 |
| 37 | Amlwch | £189,477 |
| 38 | Holyhead | £160,269 |
| 39 | Llanfair-yn-Neubwll | £159,925 |
| 40 | Llannerch-y-Medd | £159,202 |
Contains HM Land Registry data © Crown copyright and database right 2021. This data is licensed under the Open Government Licence v3.0.
